Members of the West Hartford Pedestrian and Bicycle Commission are looking more closely at vehicle crash data to guide their advisory recommendations to improve safety for walkers and cyclists.
At their April 2022 meeting, Commission members asked the West Hartford Town Engineer to share relevant crash data as required under town policy. Commission Chair Ed Pawlak pointed out that the West Hartford Complete Streets Policy, approved by the Town Council in 2015, mandates that the Town Manager provide Annual Reports with specific performance measures, such as “bicycle and pedestrian accident data.” When the Commission directly asked the Town Engineer to provide this data, he declined. Part of his reasoning was that annual numbers on these crashes are so small that they may be misinterpreted by the public.
While I understand the Town Engineer’s technical argument, his unilateral decision to ignore town policy fails to address the heart of the matter. Publicly sharing the best available data can help make better infrastructure decisions that will save lives. Our government leaders need to held accountable for providing data and improving safety, particularly during this rising epidemic of pedestrian and cyclist fatalities due to vehicle crashes in recent years, according to reports by CT Mirror and RealHartford.org.
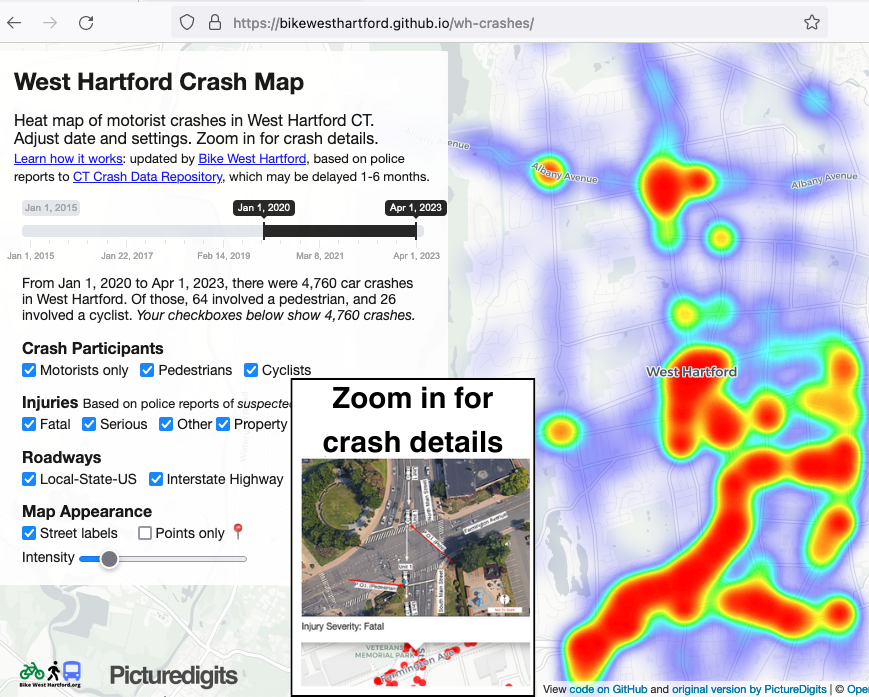
While we wait for West Hartford town officials to follow their own policies, one way to move forward is to publicly share multiple years of crash data in user-friendly formats. Today I created this interactive heatmap of car crashes in West Hartford CT, which displays data compiled from 2015 thru 2021 by the UConn Crash Data Repository. It’s cloned from the original Hartford Crash Data heatmap, an open-source template created by my friend and co-author Ilya Ilyankou at Picturedigits for Transport Hartford. The heat map displays clusters of events with orange-to-red coloring, and also allows users to adjust the date range, filter by types of crashes, and zoom in to view details about specific incidents.
